

Explain the procedure to create THERMOMETER chart?
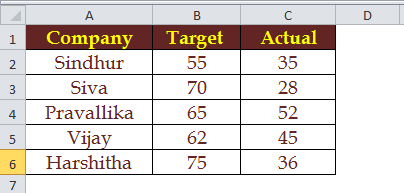
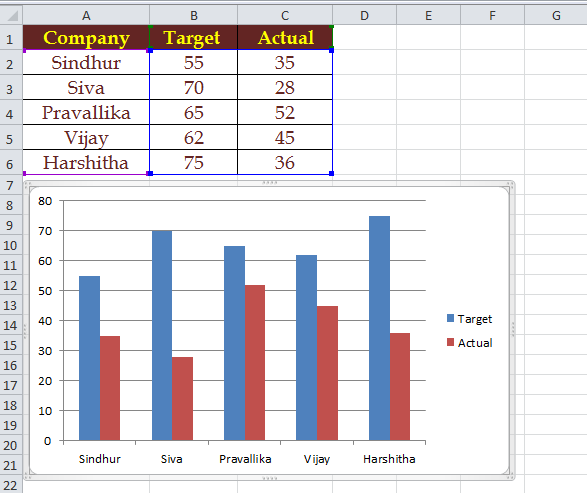
Select data and "Create a column chart"
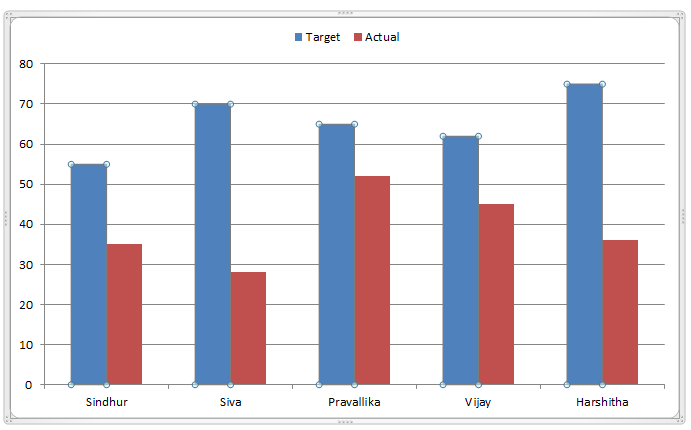
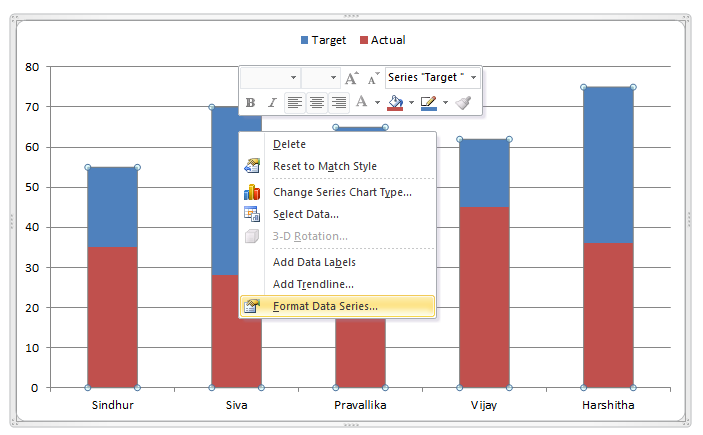
select the data series which we intends to overlap
In this case i wiould like to overlap TARGET
Right click on selected data series and select FORMAT DATA SERIES
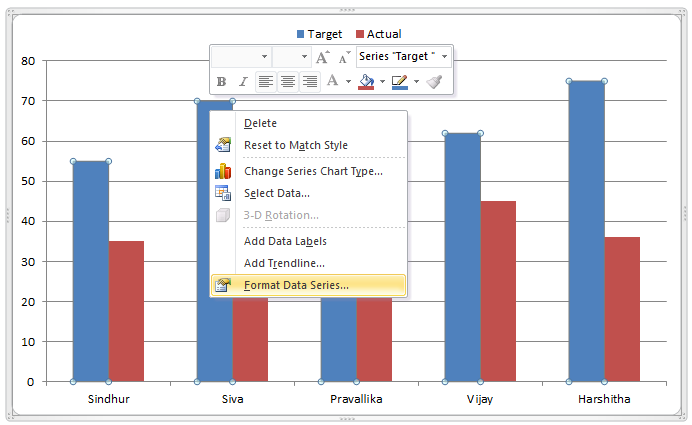
Format Data Series dialogue box will display on screen
Now increase the Overlap percentage to 100%
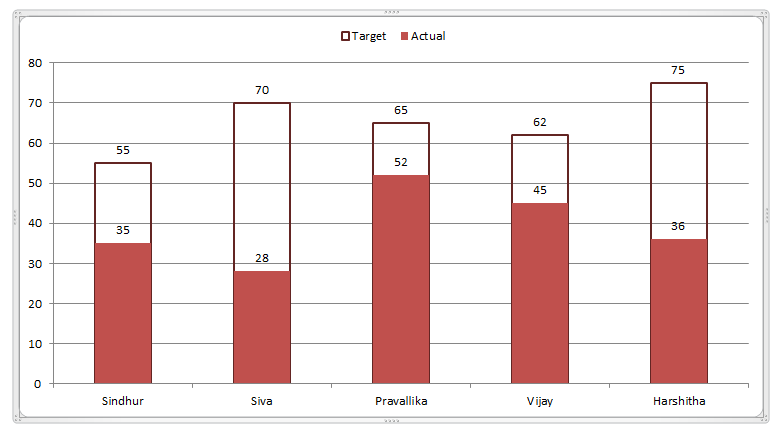
We can observe that TARGET series is overlapped on ACTUAL series
Now increase the Overlap percentage to 100%
We can observe that TARGET series is overlapped on ACTUAL series
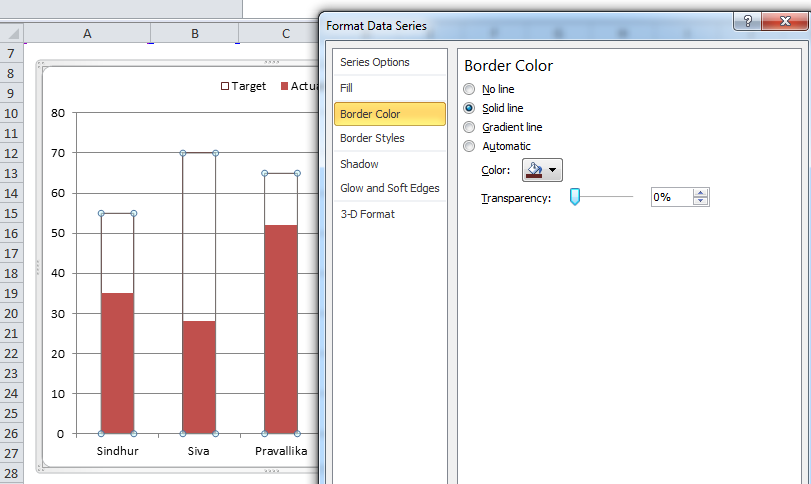
Now click on "No Fill"
Now customize the border color as per your requirement"
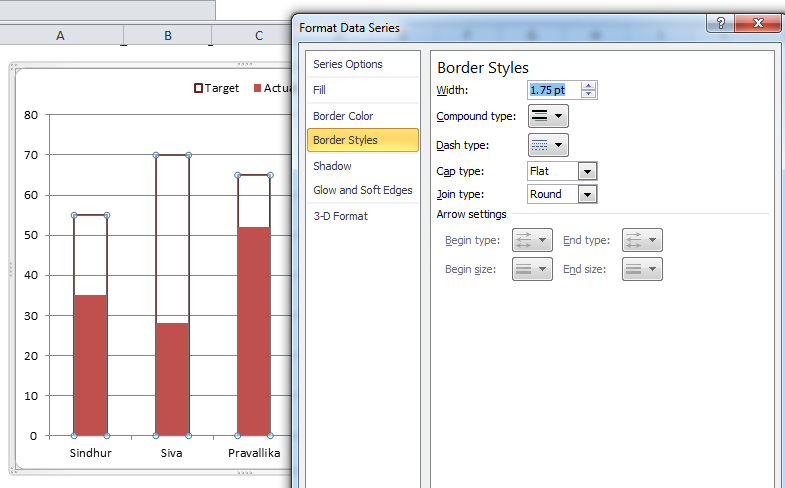
Now customize the border style as per your requirement"
Mark lables outside of column
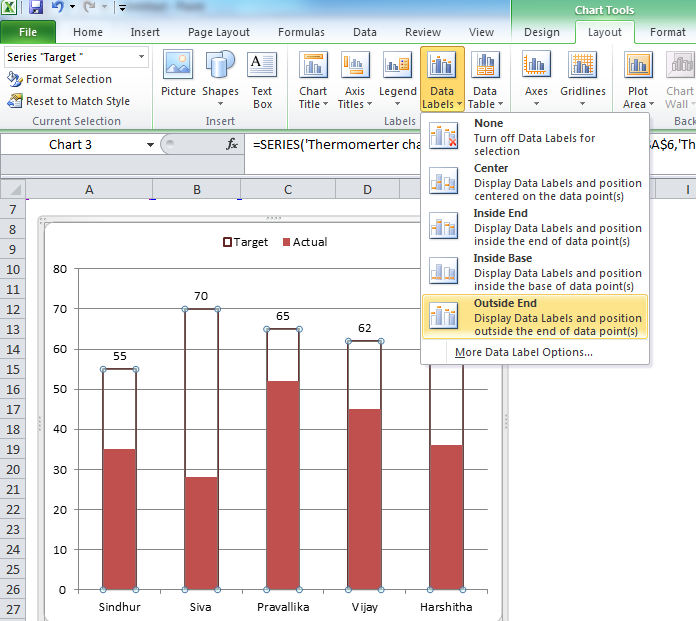
Place labels of ACTUAL outside of columns
This is final output of THERMOMETER chart

Hi Welcome to VBA Tutorial.
Thanks,
Pavan Kumar Gundlapalli