

Explain about the LOGARITHMIC AXIS?

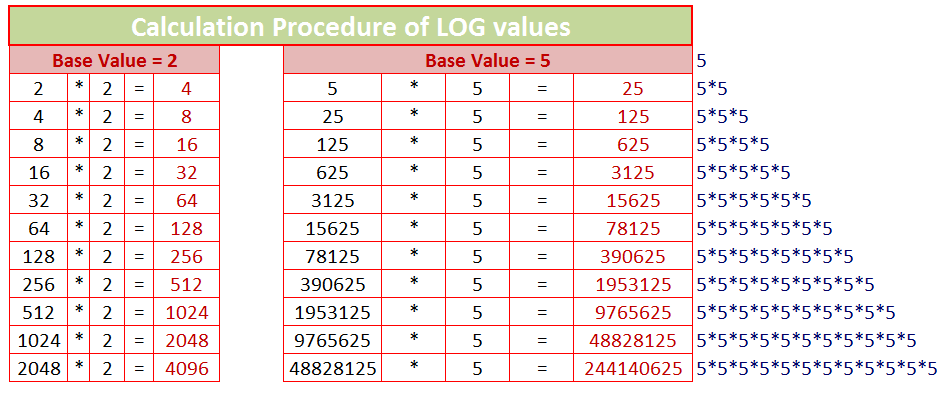
We can observe how Log scale is useful based on below mentioned table
If we charted below mentioned table with actual scale, here is the output
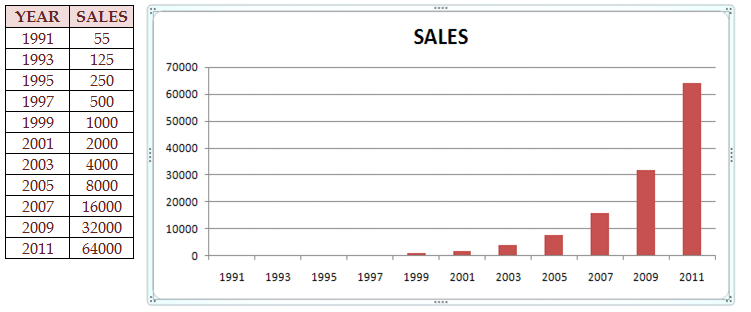
There is abnormal variation between SMALL number of LARGE number
If we observe the chart, small values less than 1000 not displaying on chart.
Because Application by default considered 1000 as Minimum value.
From the year 1999 onwards values are displaying on chart
By default excel determines Min and Max values
Log scale is useful when we have huge variation between Min and Max values
Log scale is not useful for negative or zero values(<=0)
Default value for LOG scale is 10
Select vertical axis scale
Right Click on scale
select the option of Format Axis
Change the scale value and click on close
Now LOG scale has been plotted on vertical axis of chart
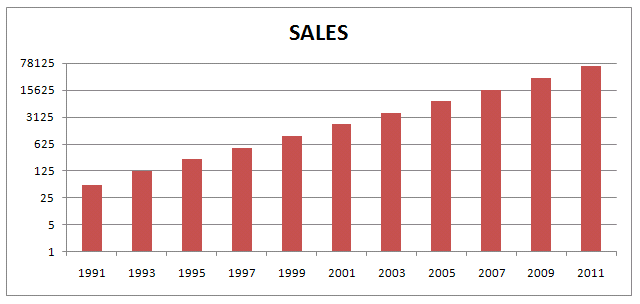
Now we can find all the year's data on chart

Hi Welcome to VBA Tutorial.
Thanks,
Pavan Kumar Gundlapalli