

Explain the procedure to create Dynamic Chart?
Dynamic Chart represents expansion of chart whenever data has been added
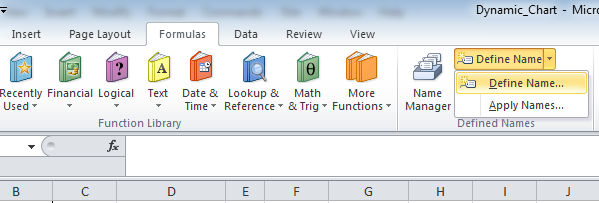
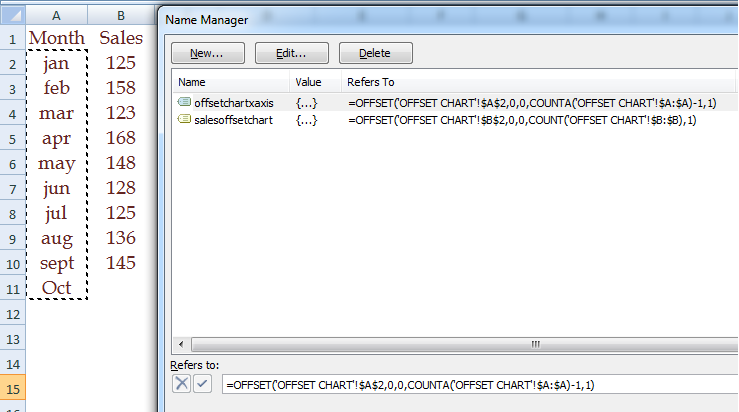
Define Name
Press CTRL+F3 to display name dialogue box
Name the SALES data
Name the AGENT data
Cross check Agent data
Cross check SALES data
Select the required chart
Chart dialoge box generates on screen
Click on CHART BOX
CHART TOOLS tab display on screen
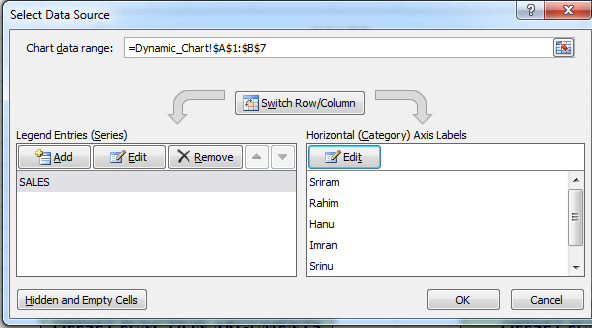
CHART TOOLS - - - DESIGN - - -SELECT DATA
Click on ADD in SELECT DATA SOURCE dialogue box
Enter the worksheet name and press F3
Names dialogue box displays on screen
Select SALES name
Click on OK
Now name added
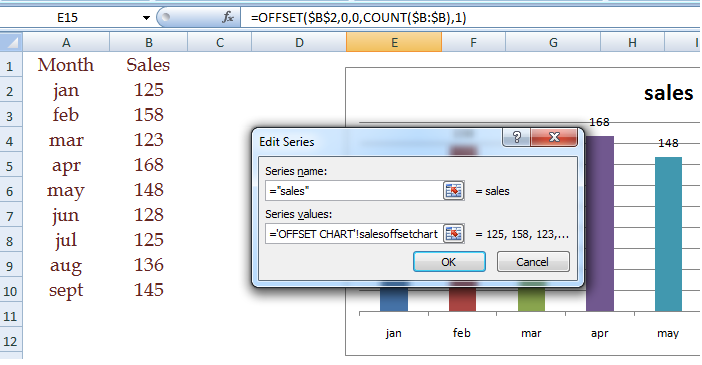
Now click on EDIT to add data for Horizontal axis

Now select the AGENT
Click on OK
Now AGENT name added
Now click on OK
Now customize the chart by adding DATA LABELS and changing LEGEND position
This is final output of chart
Why chart is not considered Anjani & Ram names?
Offset function defined as "Horizontal axis value depends on Vertial Axis value
Hence chart not considered names of agents which is mentioned against blank cell of SALES
Whenever i updated the table in same proportion chart has been expanded
Dynamic Chart - Example
- Create names in NAME MANAGER as mentioned below
- Add names to chart data


Hi Welcome to VBA Tutorial.
Thanks,
Pavan Kumar Gundlapalli