

Excel
VBA
Excel- Charts Introduction
Types of Charts
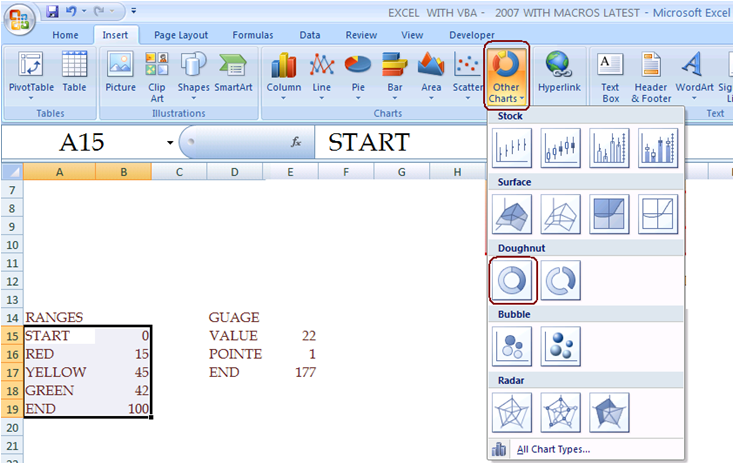
Speedometer Chart
- This chart is the combination of DOUGHNUT chart and PIE chart
- Select the data and insert DOUGHNUT chart
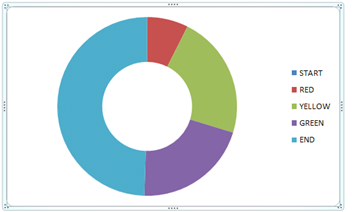
- Result
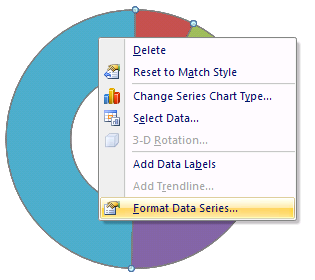
- Right Click on chart
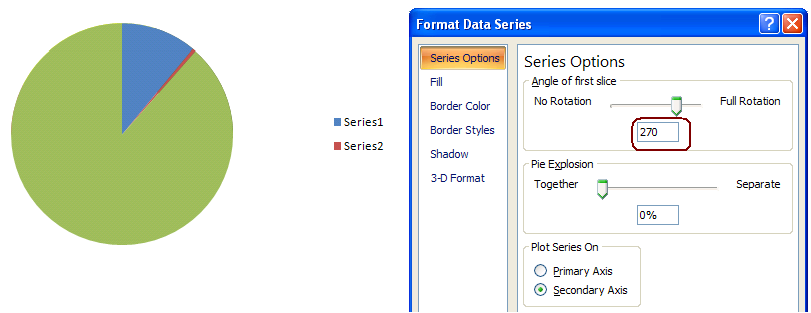
- Click on FORMAT DATA SERIES
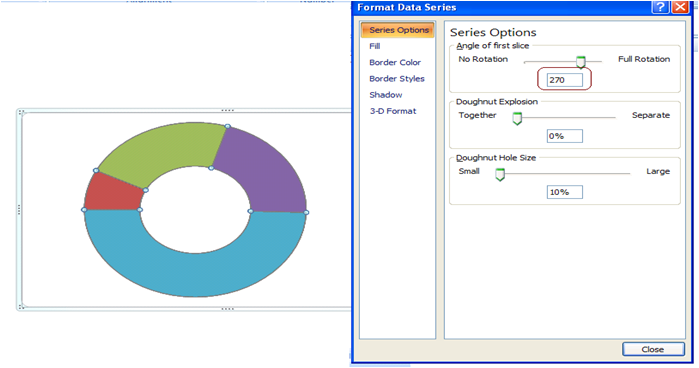
- In series option "Angle of first slice" to 270
- Click two times on blue color, consequently selection will activate
- Right Click>
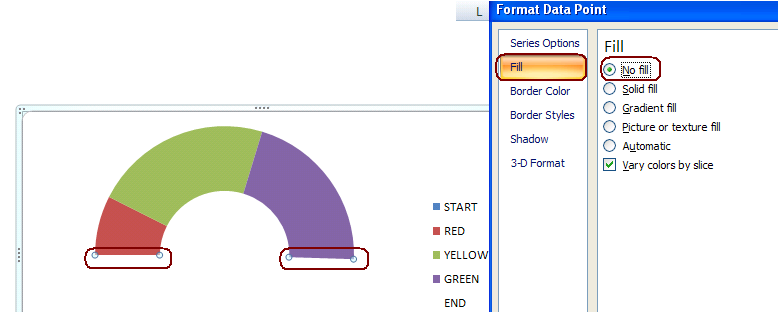
- Click on FORMAT DATA POINT
- FILL - Nofill
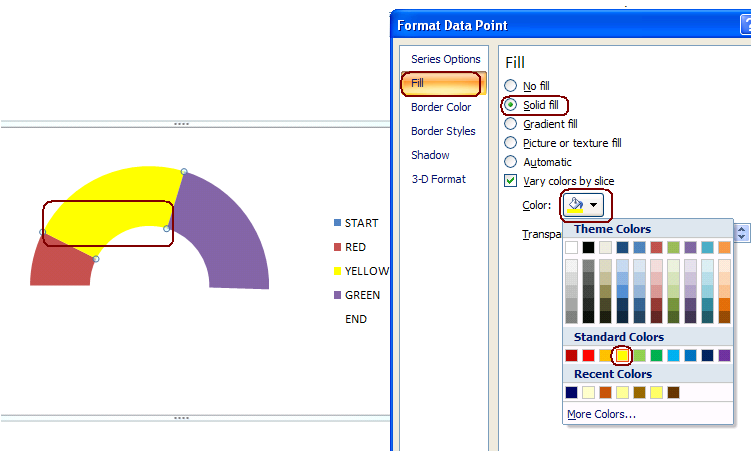
- Change the colors as per our requirement
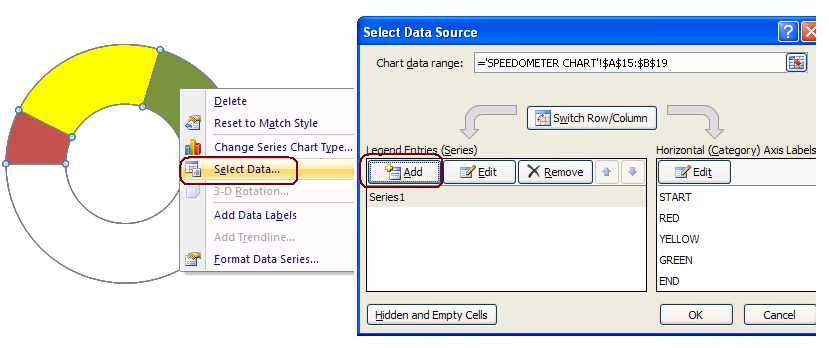
- Right click on chart
- SELECT DATA
- Click on ADD
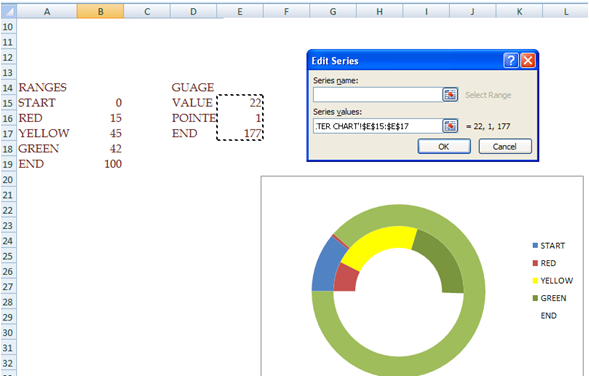
- Add values as mentioned below
- Change the 2nd DOUGHNUT CHART into PIE CHART.,
- Change the rotation to 270
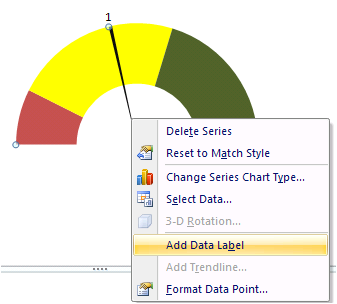
- Select NO FILL from FILL option against the GREEN AND BLUE portions
- Click needle two times, to select needle
- Right click ADD DATA LABLE for needle
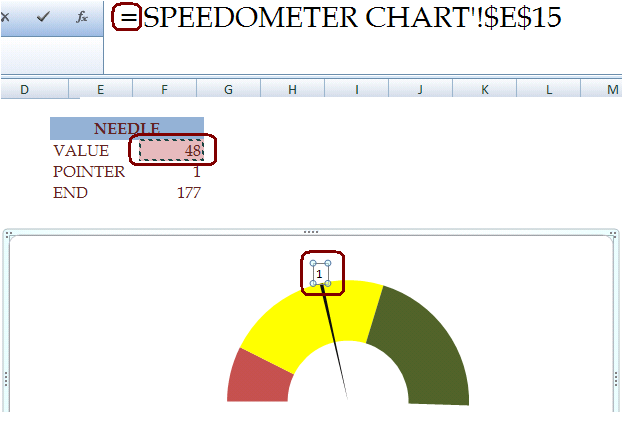
- Double click on DATA LABLE
- Place =, and select value
- Henceforth whatever the value we mentioned in VALUE cell, it will update at the end of needle as data lable


Hi Welcome to VBA Tutorial.
Thanks,
Pavan Kumar Gundlapalli