

Enable Developer Tab
Click on INSERT
Select CHECKBOX
Place the check box in blank cell as per your requirement
Create 3 check boxes for required table headers
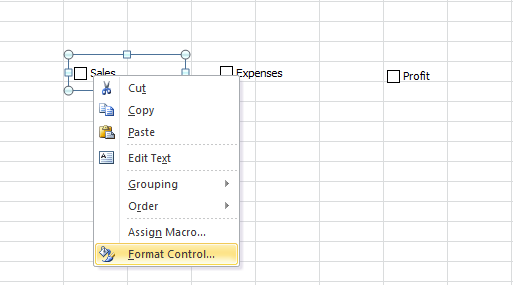
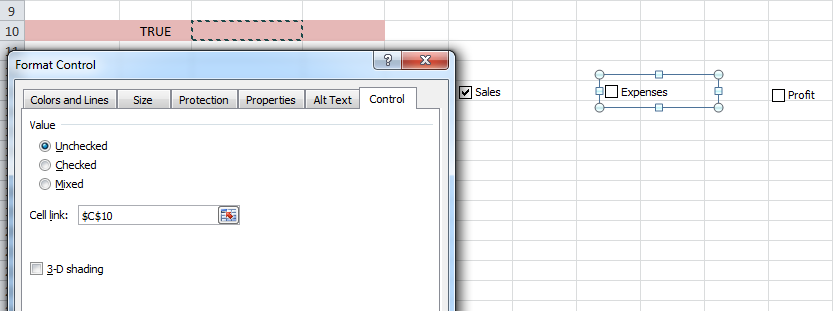
Right click on Check-box
Select "Format control"
select a cell to dispaly value of check-box
Now i am selected B10 cell
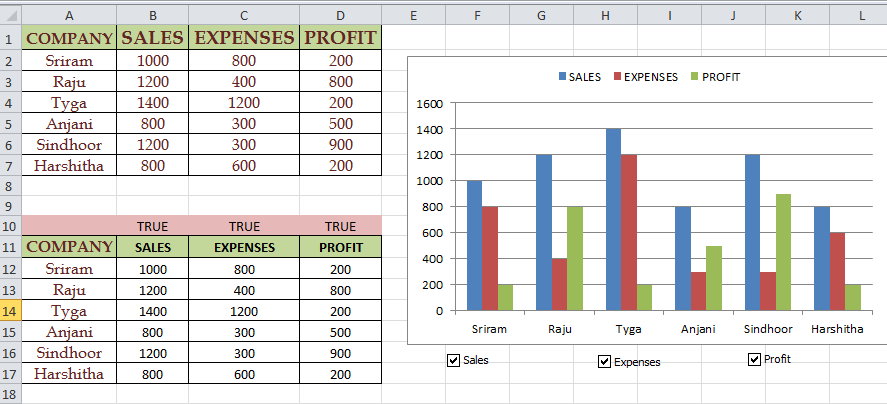
If we select the check box relevant cell displays as TRUE otherwise FALSE
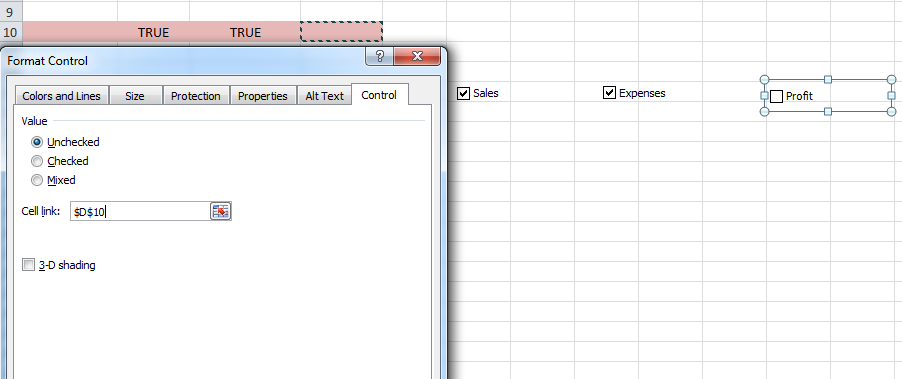
Repeat the same process and assign a cell to display the values against the EXPENSES check box
Repeat the same process and assign a cell to display the values against the PROFIT check box
Copy the table structure beldow TRUE
Use IF function to copy the data in table
Drag the formula for all the required cells
Repeat the same process for EXPENSES
Drag the formule for all the required cells
Repeat the same process for PROFIT
drag the formula for all the required cells
Select data and create chart
Now chart created
Convert Normal chart into thermometer chart
Right click on SALES series in chart
Increase OVERLAP percentage to 100
Select No fill for sales portion
Right click on PROFIT Series
Select the option of CHANGE SERIES CHART TYPE
Select LINE chart
Click on OK
Explain the procedure to create chart with CHECK-BOX?

Hi Welcome to VBA Tutorial.
Thanks,
Pavan Kumar Gundlapalli