

Combination Chart - Two Different Scales in single chart
- Through this chart we can provide comparision between two different scales
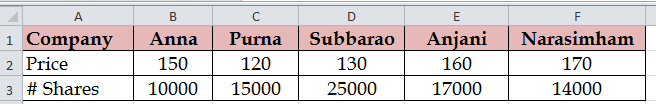
In this example we have two different scales i.e "Shares and Price" against the each company.
These two having abnormal variation withrespect to UNITS and also represens to two different measurements.
Price represents to in terms of DOLLARS whereas shares represents to terms of NUMBERS
If we plot these two against the single scale, data which is having minor units not visible on chart.
In this scenario we need to create SECONDARY AXIS
Click on INSERT tab
Select the required chart type
In this example i am selecting COLUMN chart
Now two series are plotted on single axis
In the below chart price is not visible for us as those numbers are nominal
I would like to plot those(price) numbers on secondary axis
SELECT the price series on chart
RIGHT click on selected series(price)
Select FORMAT DATA SERIES option
FORMAT DATA SERIES dialogue box will display on screen
By default "plot series on" selected against PRIMARY AXIS
Now change the option to "Secondary Axis"
It indicates that, We are instructing to application to changte the selected series to SECONDARY
Now share price has been plotted on SECONDARY AXIS
But on vertical axis both price and shares having same chart pattern we are not able to identify
Now change the chart type as LINE for PRICE
Select the PRICE series
Right click
Change series chart type
Select a LINE CHART
Click on OK
Final output of shares and price
Change the LEGEND position
Place the data labels on price line
Place the data labels "out side end"
Explain the procedure to create COMBINATION chart?
This chart is very useful when we need to compare two different data sets which consits of different scales.

Legend Position has been changed
We can change as many as adjustments based on our requirements by using CHART TOOLS


Hi Welcome to VBA Tutorial.
Thanks,
Pavan Kumar Gundlapalli