OOPS
Errors
Pandas
File Handling
- r = red
- g = green
- b = blue
- c = cyan
- m = magneta
- k = black
- w = white
- y = yellow
- Restricted Yaxis values between the range of 5 to 30
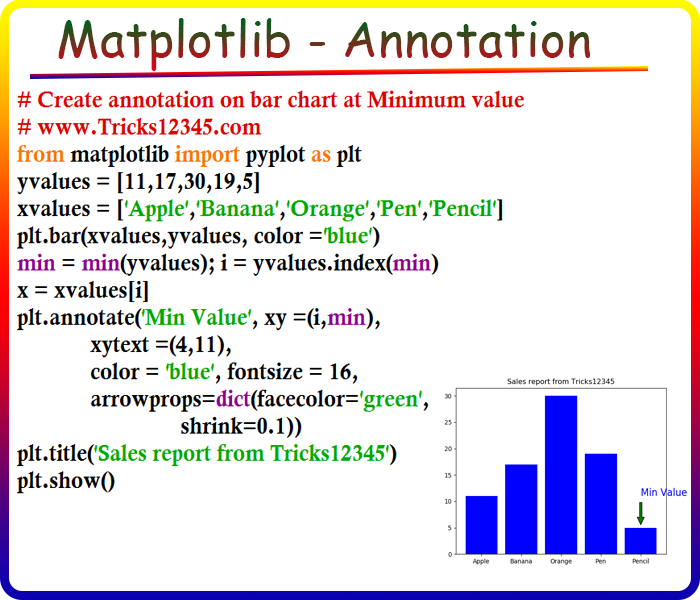
- Create a comment on Bar chart at Min value with arrow key
- Arrow mark will be placed at min value, even values changed
Color symbols for bars in Matplotlib
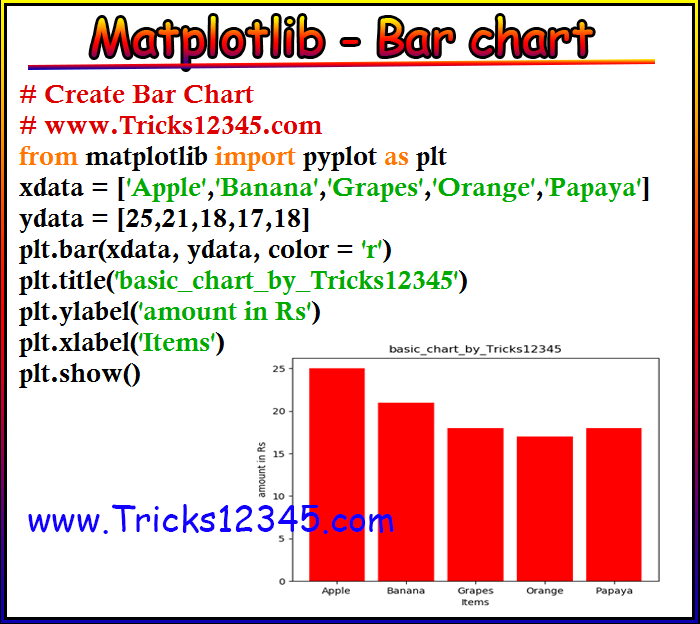
Matplotlib Bar chart

Yaxis limit defined to Bar chart


Create Annotation at Bar chart

Different color for each bar


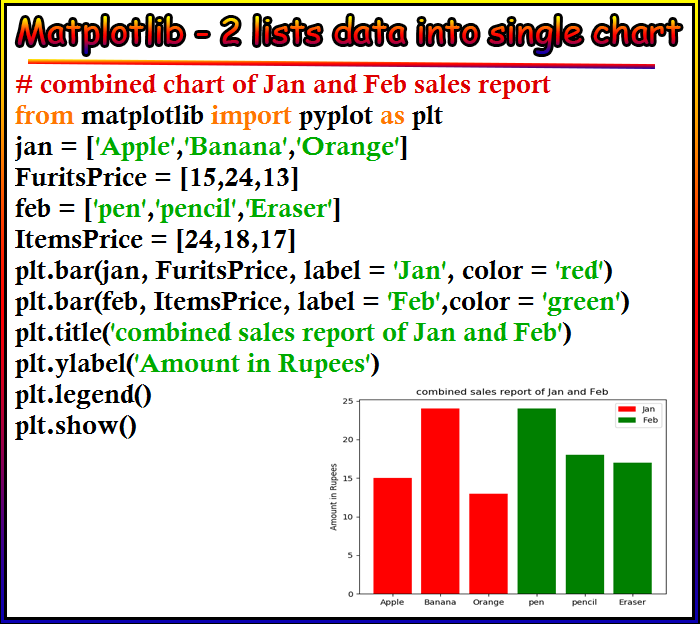
Bar chart with two data items


Bar chart two x values and two y values

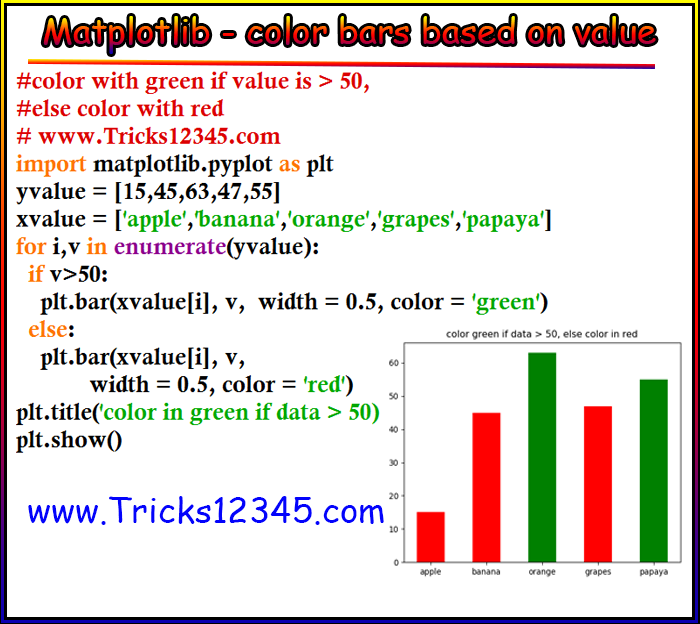
Color bars based on its value

Max value bar color in Blue


Min value bar color in red



 Hi Welcome to Python Tutorial.