

OOPS
Errors
Pandas
File Handling
- None: No connecting Line
- + . o *
- p = pentagon
- D = Diamond
- S = square
- X = Character
- ^ = Triangle
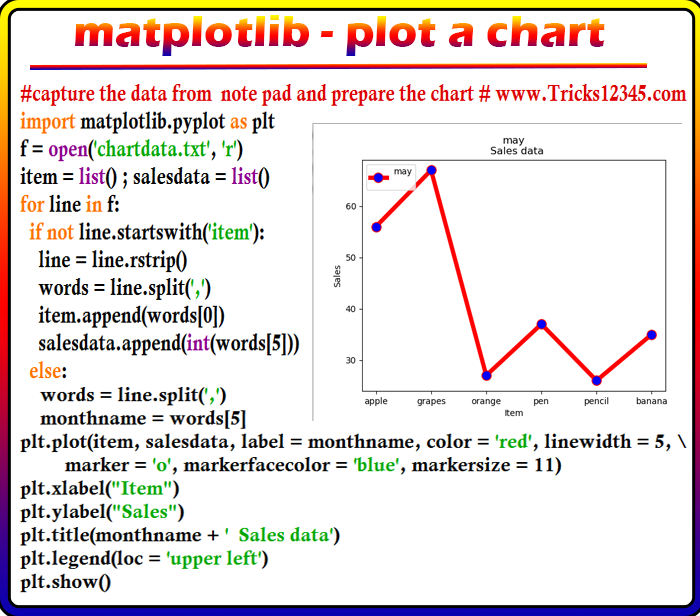
- text document consits of sales data from jan to may
- prepare the chart by changing the index number in SALES DATA LIST
- This is dynamic template, you can add more number of months and change the month as per your requirement
- Defined xtick values and Ytick values through range method
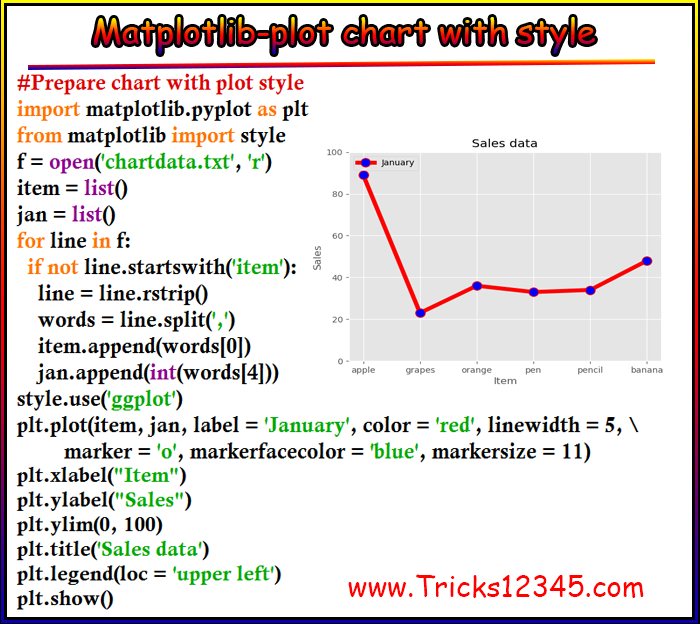
- We mention the styles of plot chart as per our requirement
colors

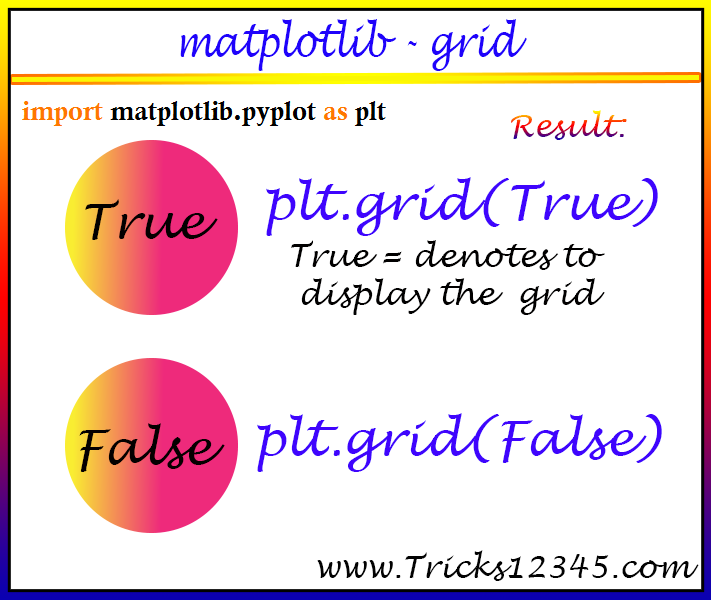
grid syntax
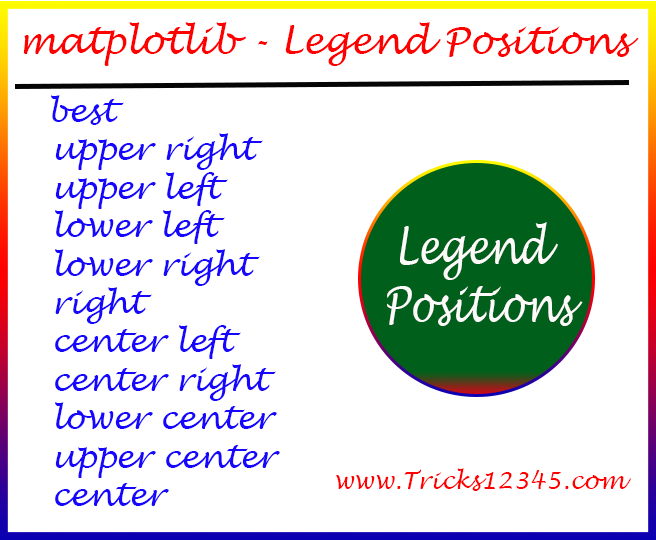
Matplotlib_Legend_Positions
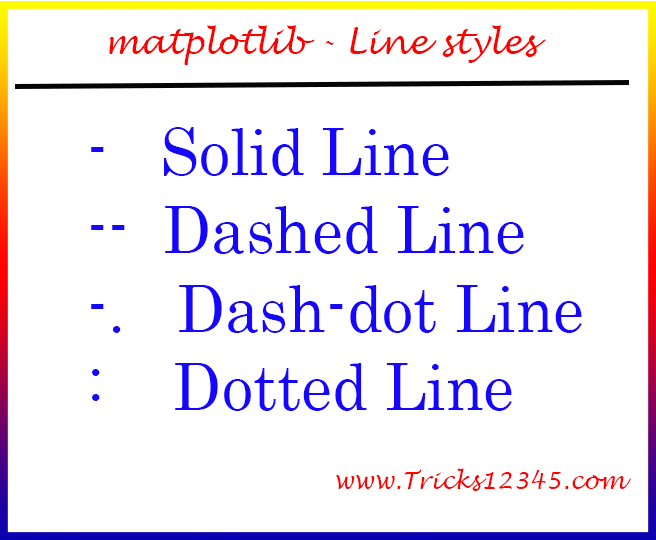
Matplotlib_Line styles
Marker symbols:
matplotlib - chart with marker styles


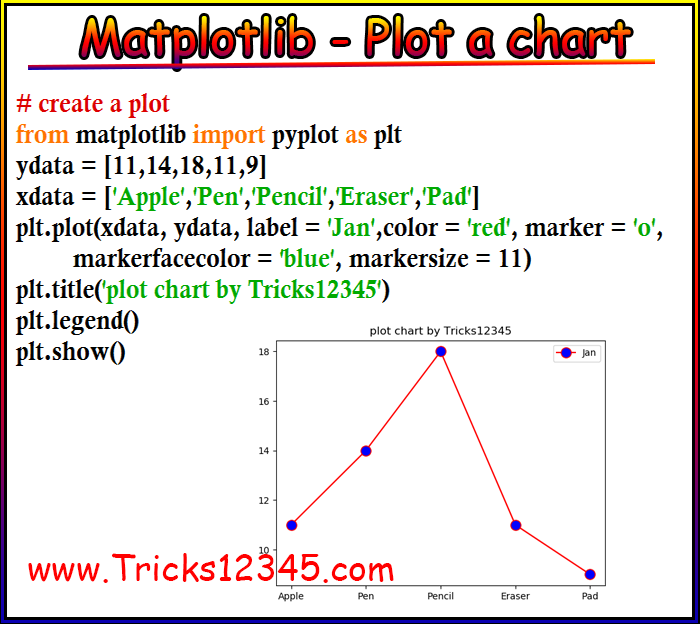
matplotlib - plot a chart
matplotlib - data from text file
matplotlib - define xtick and ytick values

Matplotlib - plot with two lines

Matplotlib - Chart with style
 Hi Welcome to Python Tutorial.
Thanks,
Pavan Kumar Gundlapalli